For anyone curious about starting out in SDR, receiving satellite images by building your own antenna is an excellent way to get a solid grounding in RF. We’ll take this project further by automating the reception of satellite images.
Project Overview
Who are the NOAA?
The NOAA satellites are American weather satellites orbiting at approximately 850km. For comparison, the ISS flies at about 400km.
Currently, there are 3 that will interest us:
Their frequencies are public, so anyone with the right gear can capture their images. Although these satellites are no longer in active service, as long as NASA doesn’t deem them a risk, they keep on flying.
Sun-Synchronous Orbit
These satellites have a circular orbit that takes them over Earth’s poles. They follow a polar, more precisely, a sun-synchronous, orbit. This ensures they always present the same angle relative to the Sun:
A sun-synchronous orbit means the satellite passes over the same spot at the same solar timetwice a day.
For example, using satellite tracking software or websites (like the ones listed below), you can predict their passes based on geographic coordinates.
APT Transmission
NOAA satellites don’t directly capture photographs of Earth. They use a scanning radiometer that performs a slow scan, about 2 lines per second.
This data is transmitted using the APT (Automatic Picture Transmission) mode, dating back to 1960. Only these 3 satellites still use it. The image resolution is around 4km per pixel.
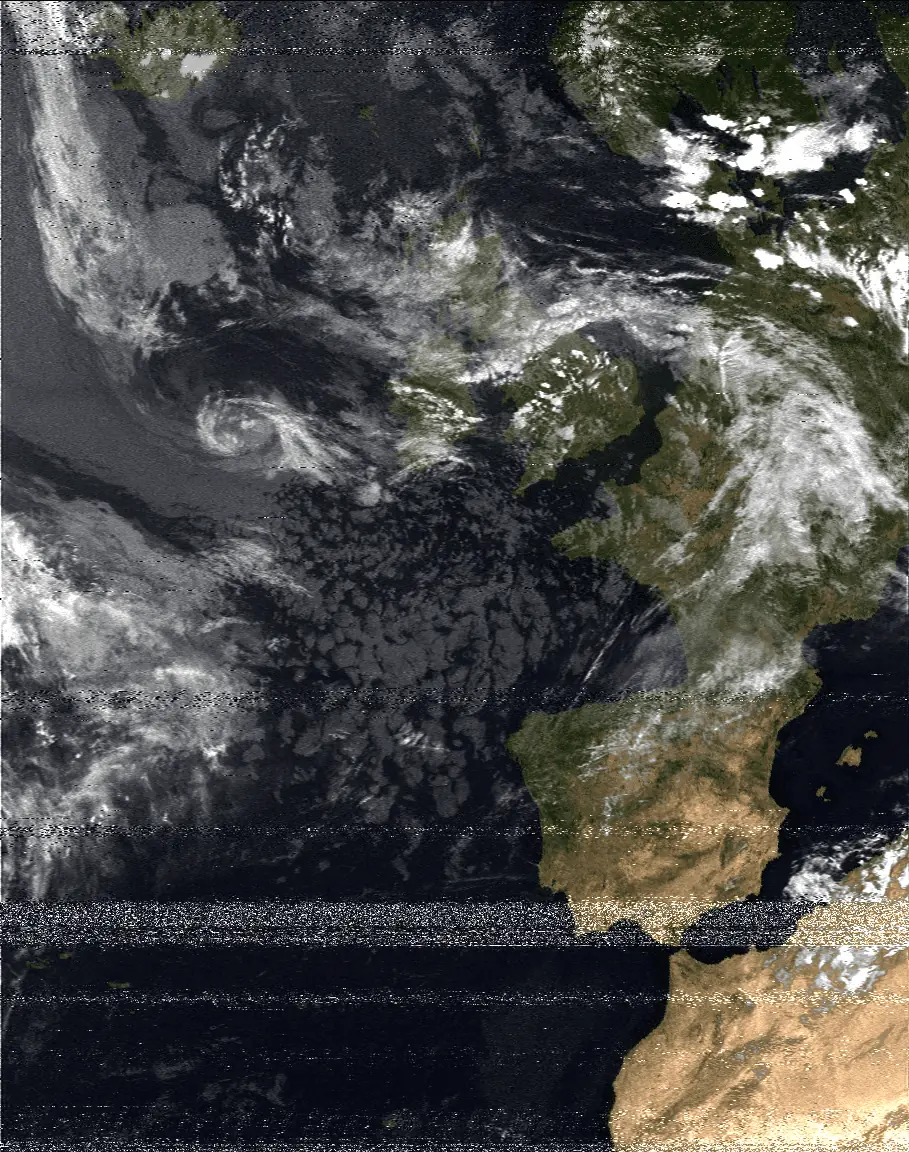
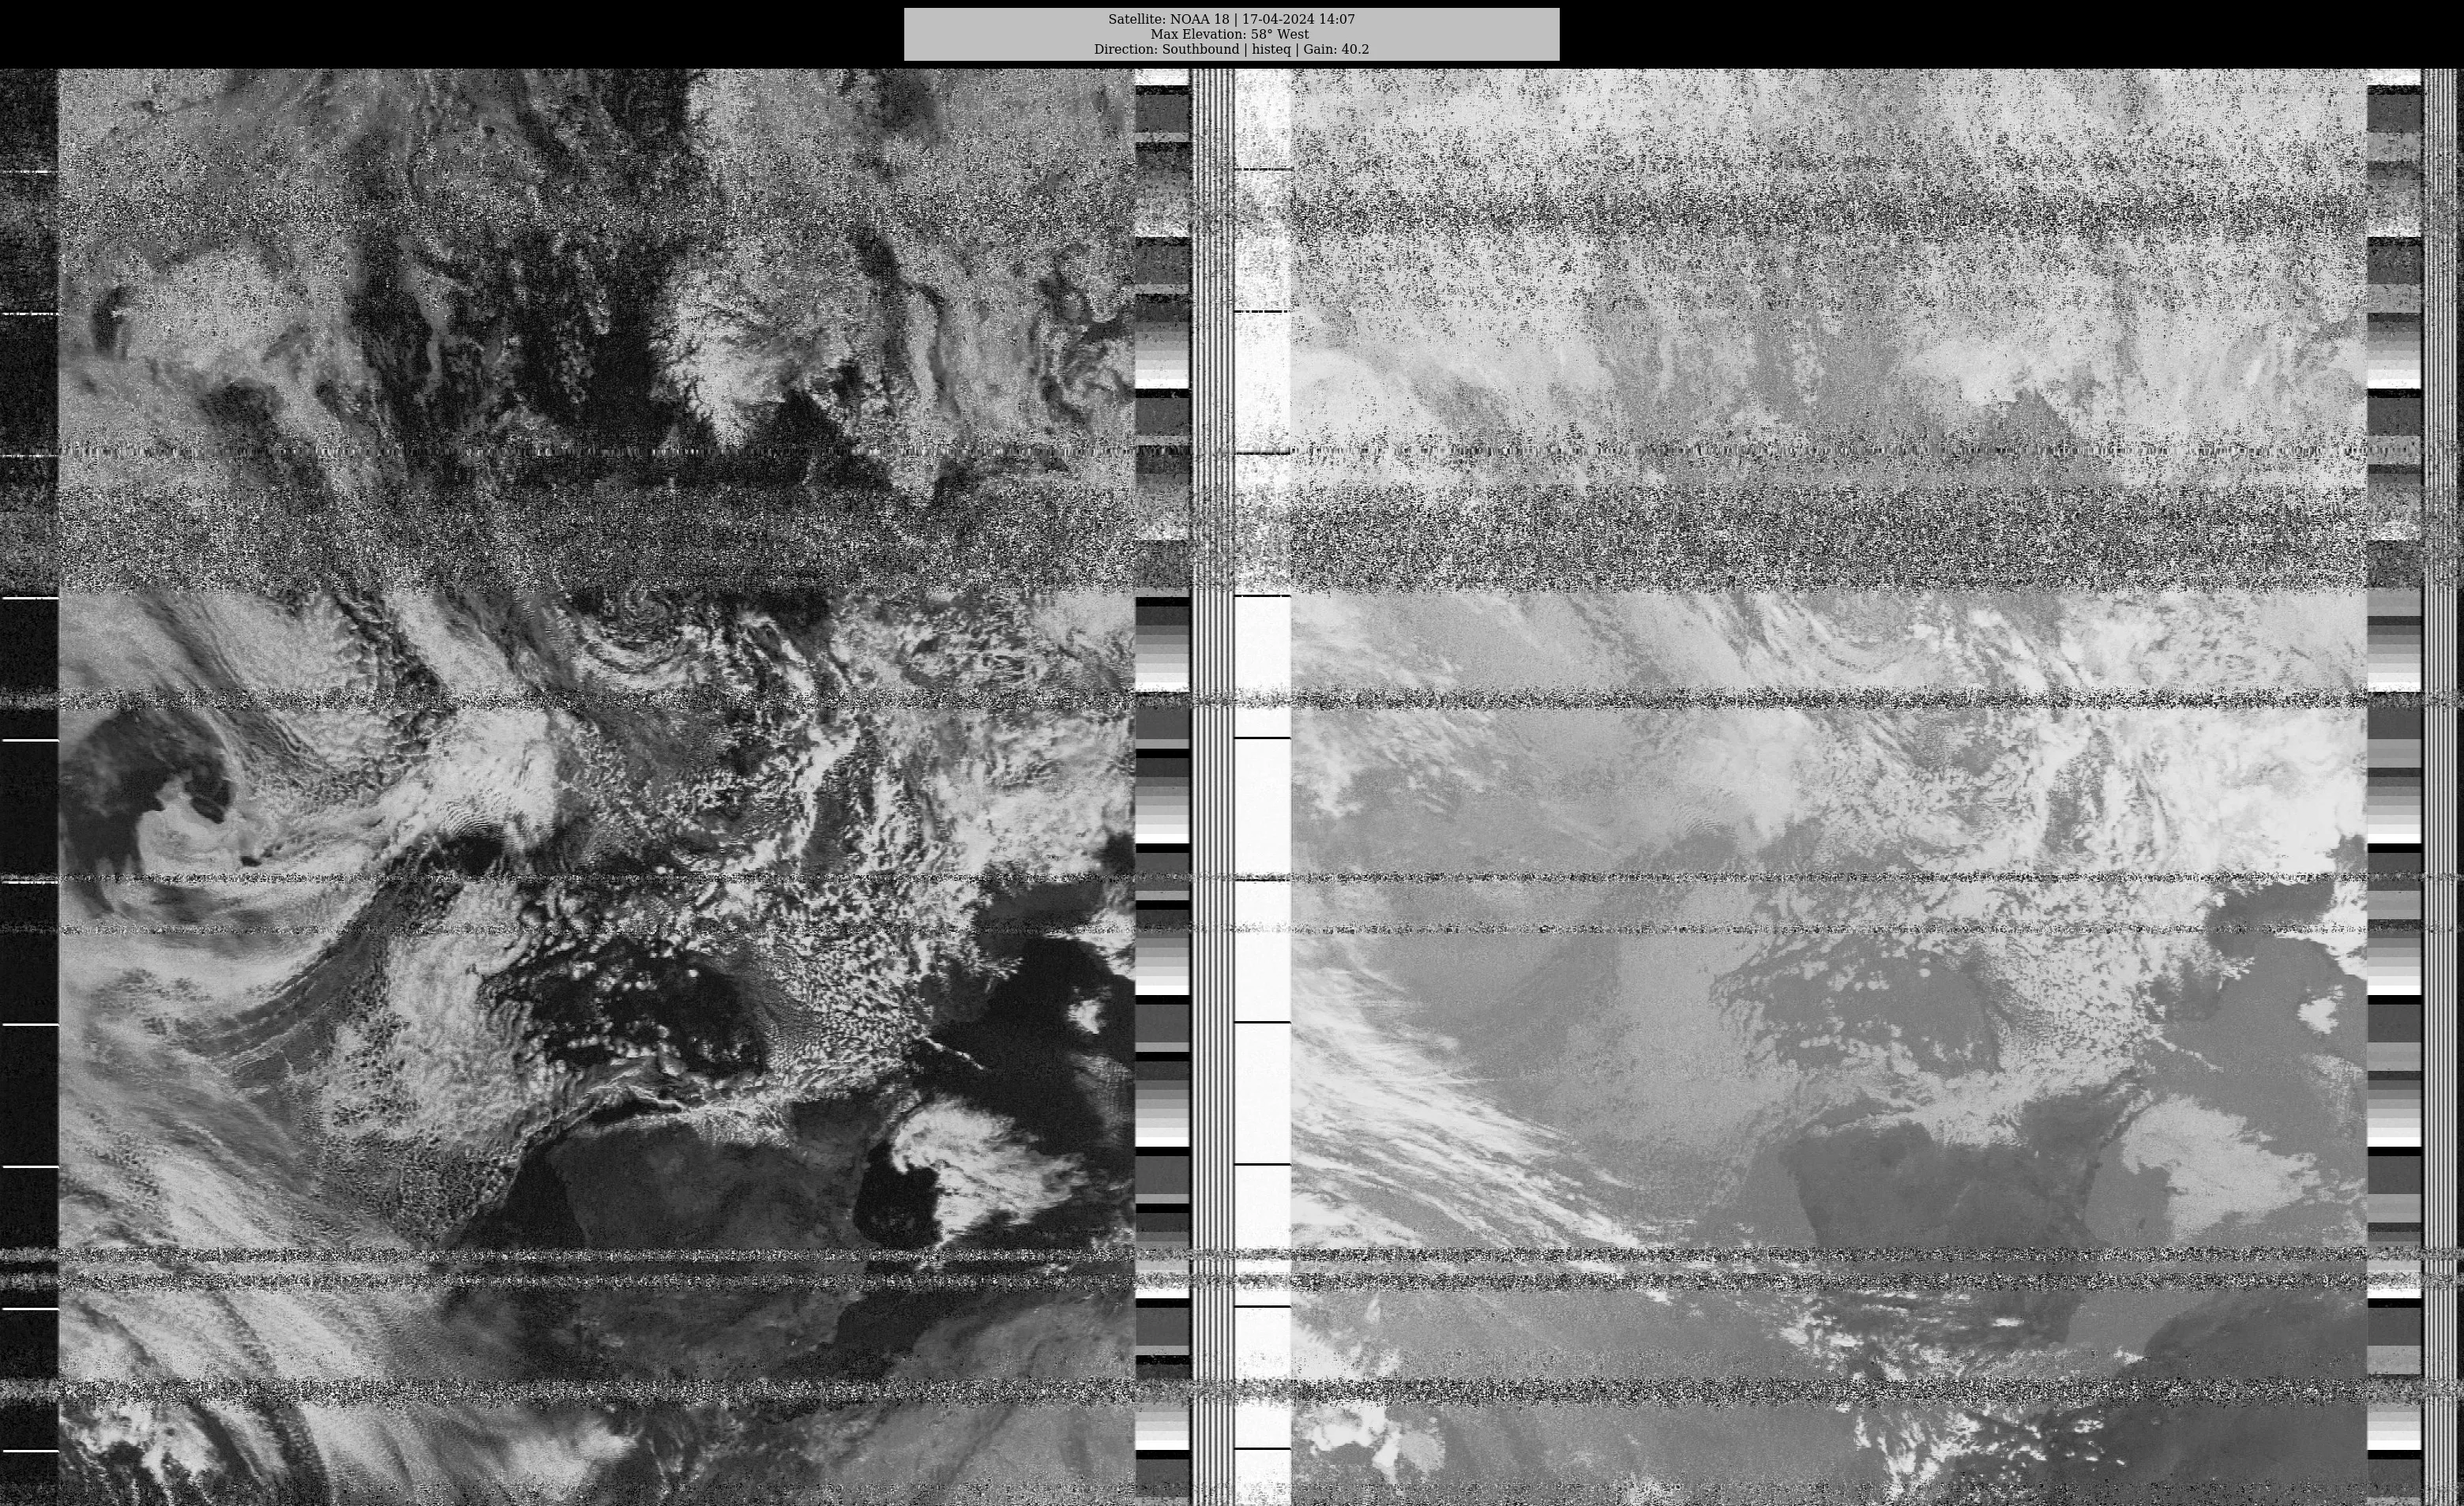
Here’s an example of an image I received using APT:
The transmission comprises two image channels, telemetry data, and synchronization bits.
The left channel is a visible-light image (although another sensor might be used depending on cloud cover).
The right channel comes from an infrared sensor.
The left-side strip of each image contains synchronization data to reassemble signals that may arrive out of order due to multipath.
The two right-side strips are telemetry data, information regarding the satellite and weather-related data.
All this data is sent line by line horizontally.
Before transmission, images undergo geometric correction to remove distortion caused by Earth’s curvature (because, you know, the Earth isn’t flat).
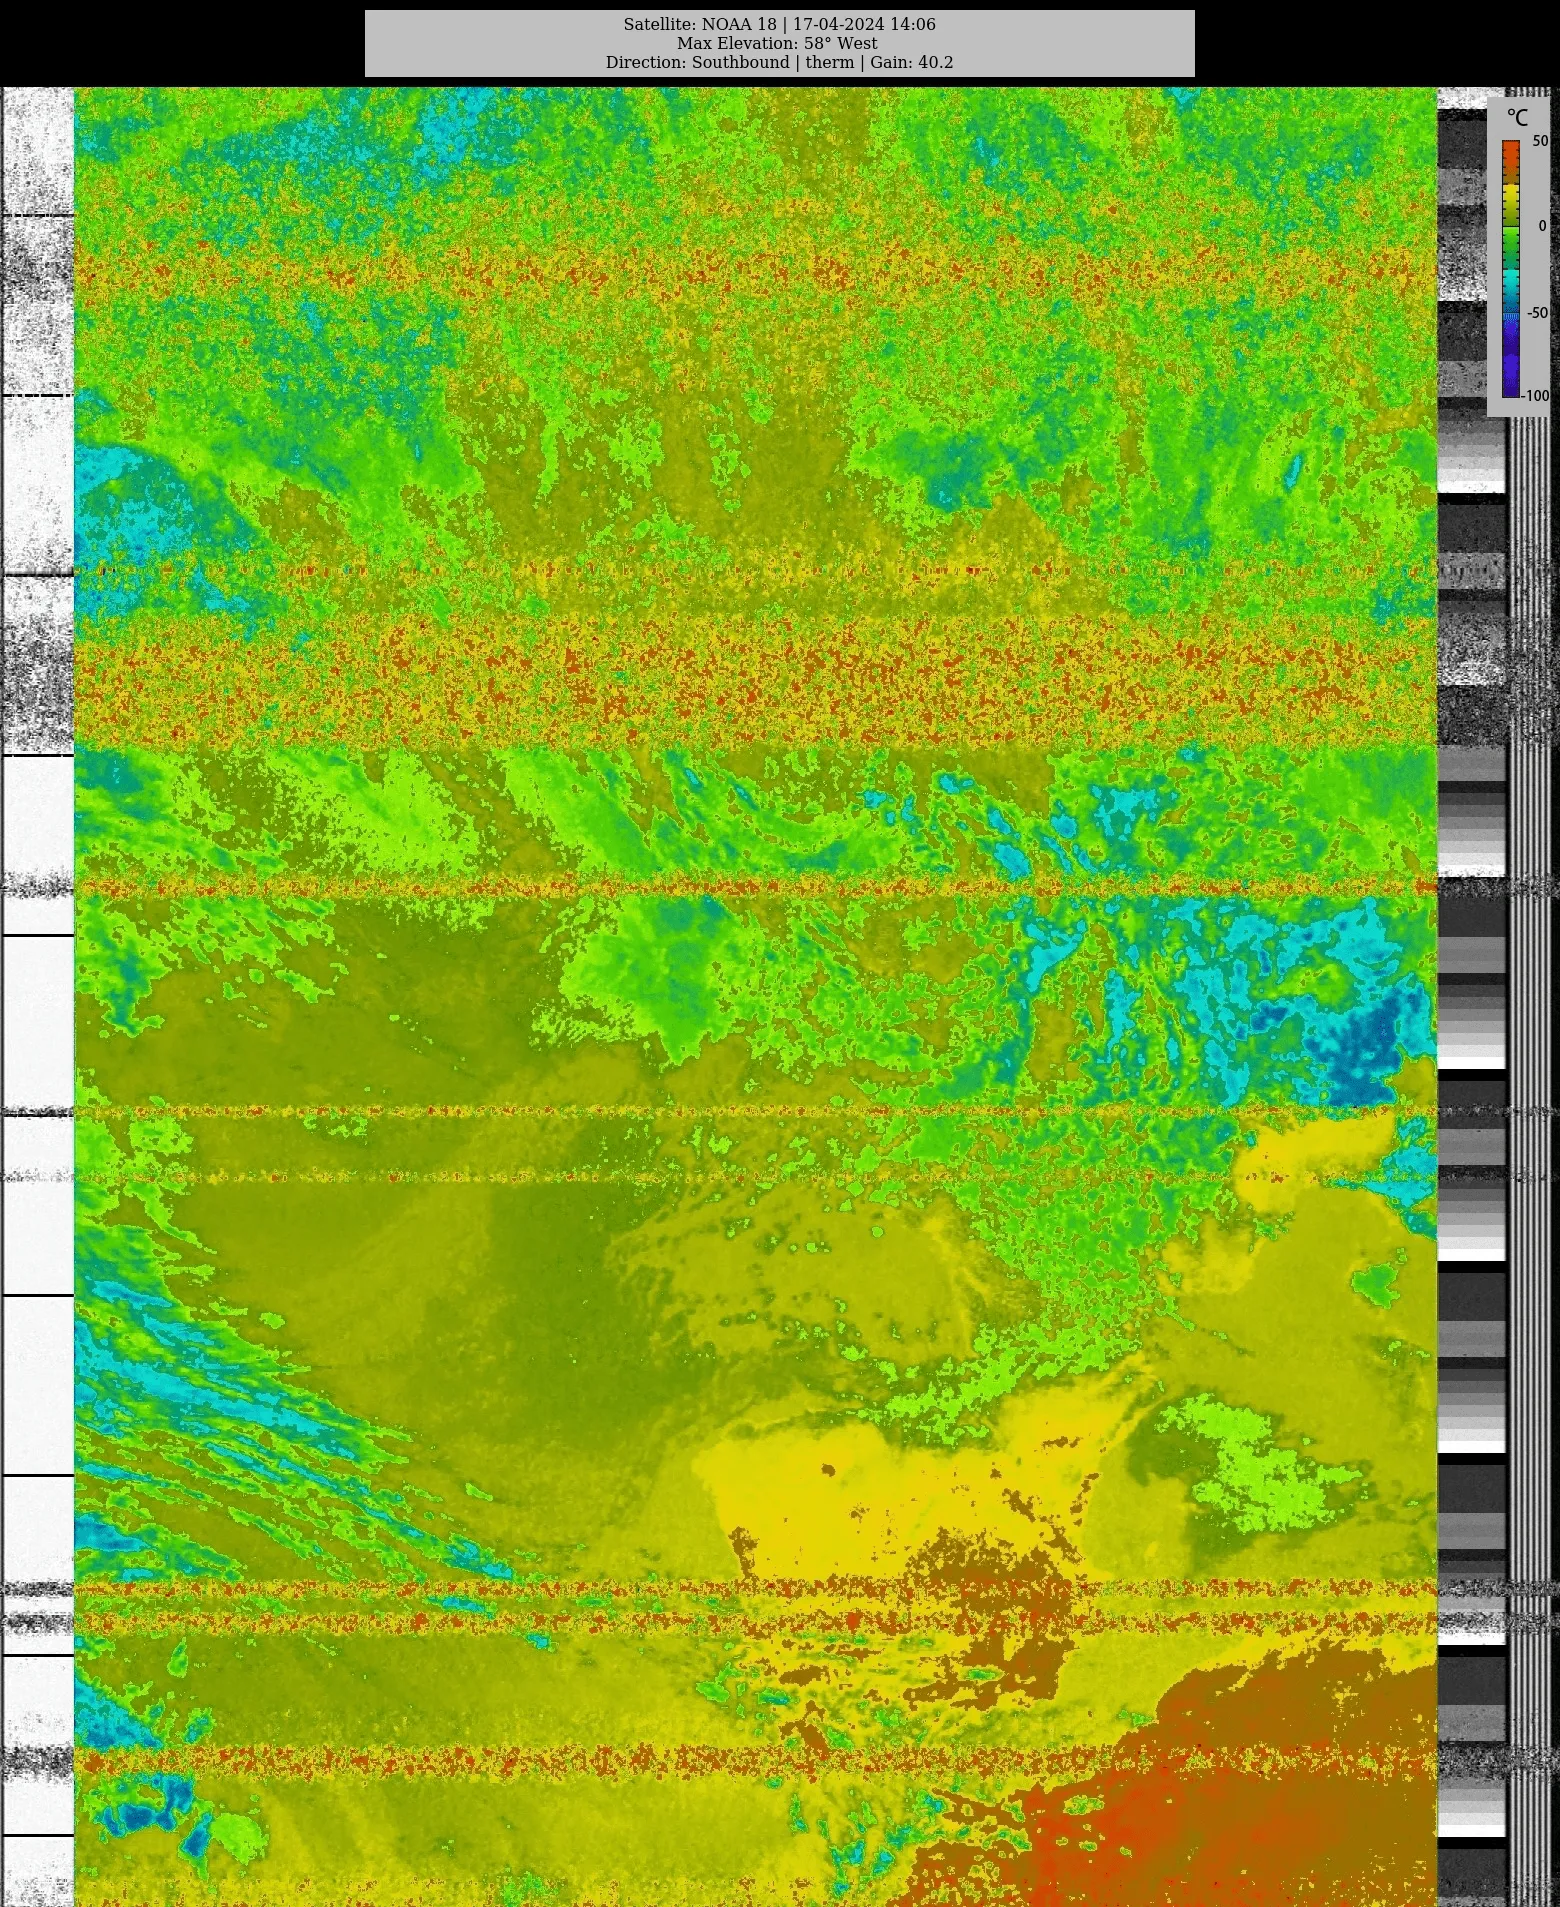
With these two images, you can generate alternate versions, for instance, a thermal image:
This type of image is key for meteorologists to predict the weather ⛈️.
How an Antenna and SDR Work
To capture these images, you need a suitable antenna and an SDR receiver.
I recommend checking out two articles: the first explains how to choose an antenna based on the frequency you want to listen to, and the second covers what SDR (Software Defined Radio) is.
Project Setup
Hardware
Building the Antenna
For this project, I opted for a V-dipole antenna to be mounted horizontally. Its radiation pattern is directed skyward, which also helps minimize interference from vertically polarized terrestrial signals.
Though not optimal (thanks to its polarization), it’s the simplest to construct. Alternatively, you could use a QFH antenna.
APT signals are robust, so even with an imperfect antenna, you’ll still pick up something, as long as you have a clear sky and mount the antenna as high as possible.
To design the antenna for 137MHz, use the calculation: λ = 300/137 ≈ 2.18m
For a half-wave antenna, it should be 2.18/2 ≈ 1.09m, and for a dipole, each leg is half of that, around 0.54m (or 54cm per leg).
To aim for a 50Ω impedance, the angle between the two legs should be 120°.
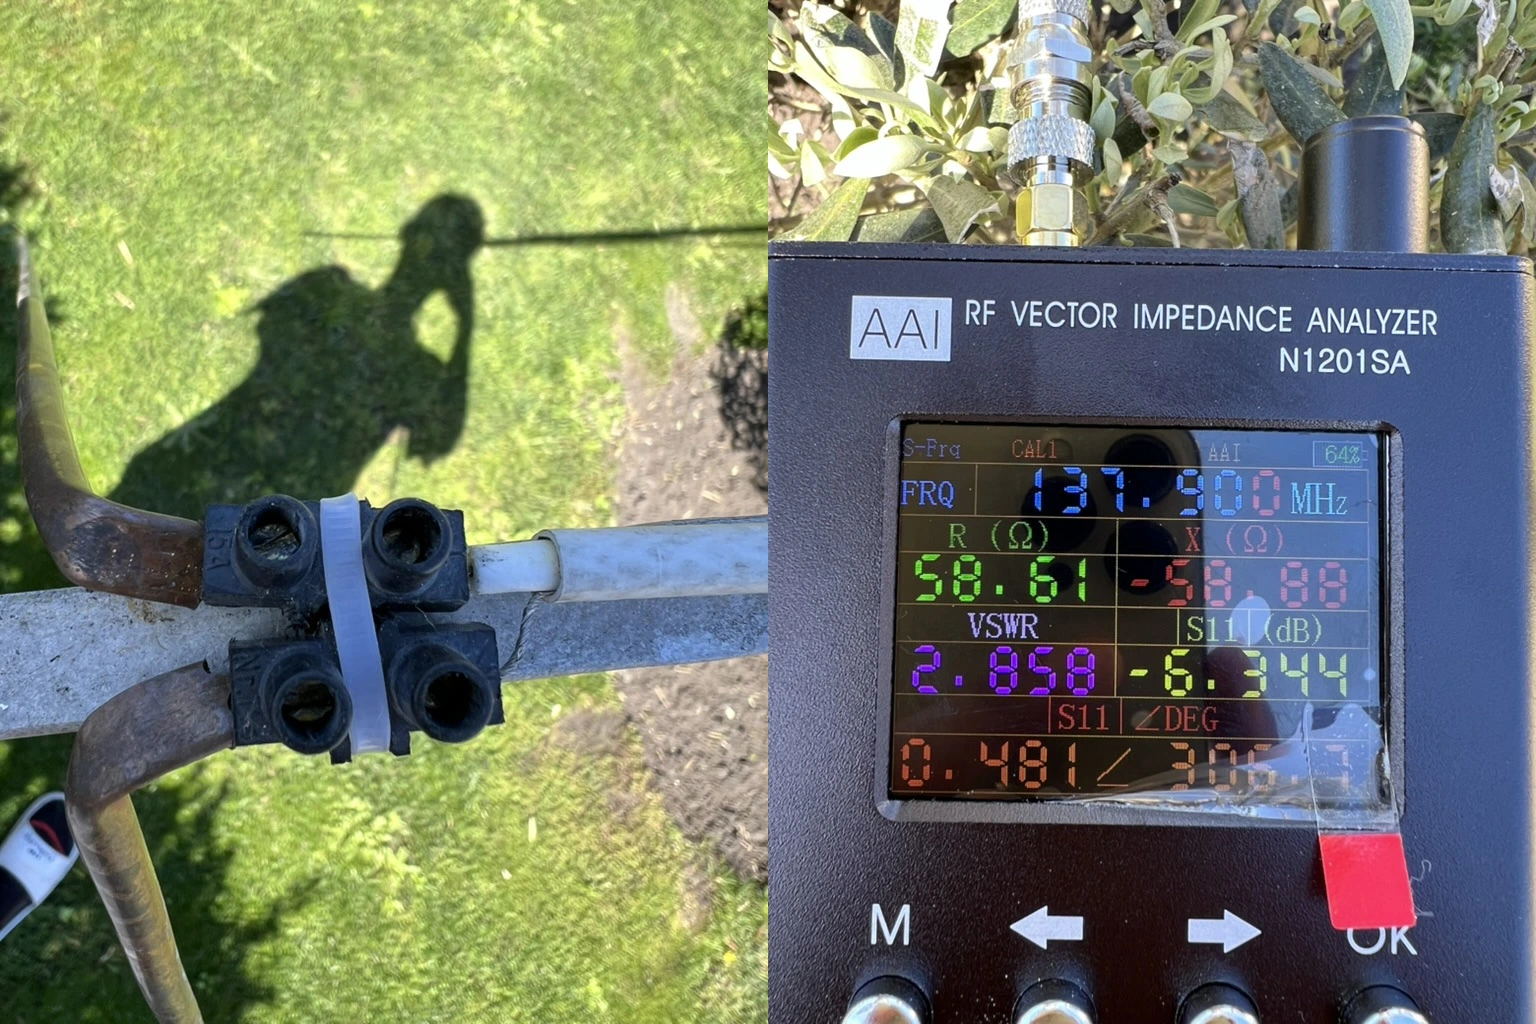
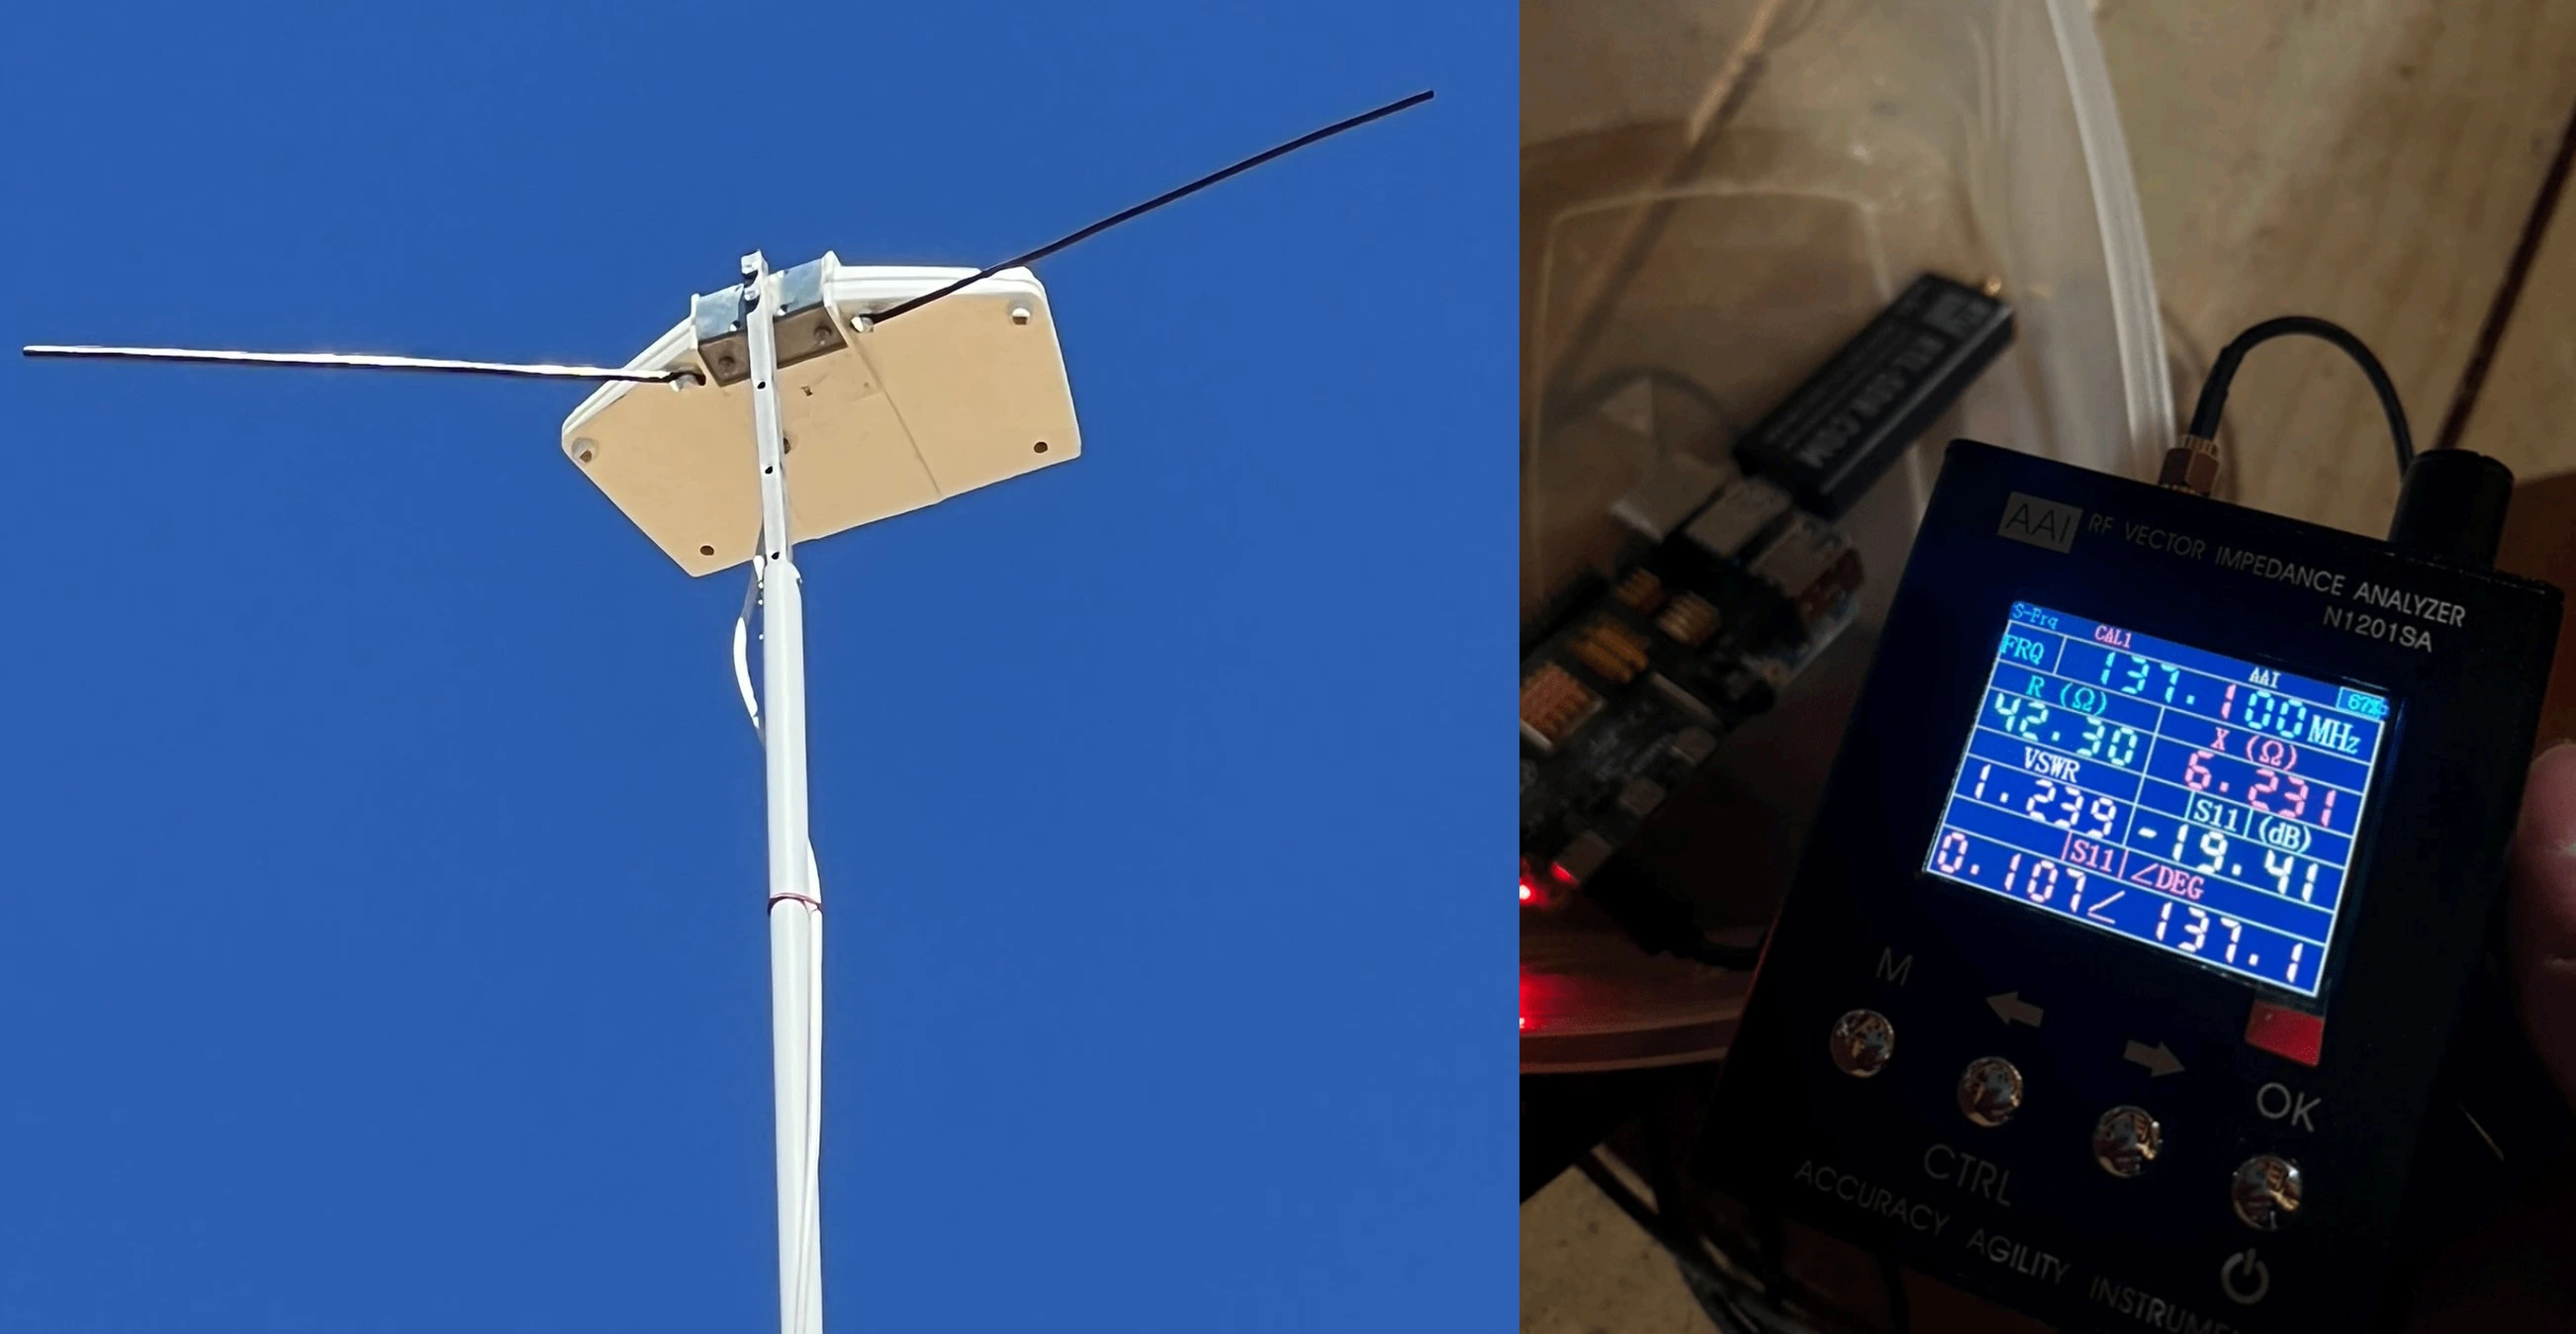
The cable is connected using a terminal block: the central conductor is attached to one leg and the shield to the other. You can measure performance with an antenna tester.
Key values:
Impedance (R (Ω)): 58Ω (close to the ideal 50Ω)
Voltage Standing Wave Ratio (VSWR): Target is near 1. Here it’s 2.8, which isn’t ideal.
Since the initial results were not convincing, I removed the terminal block and soldered the connections for better contact. I then repurposed an old caravan TV antenna to fine-tune the leg alignment and adjust the impedance. The final result is:
The VSWR is very close to 1, which is excellent.
The measured impedance is 42Ω, which is acceptable.
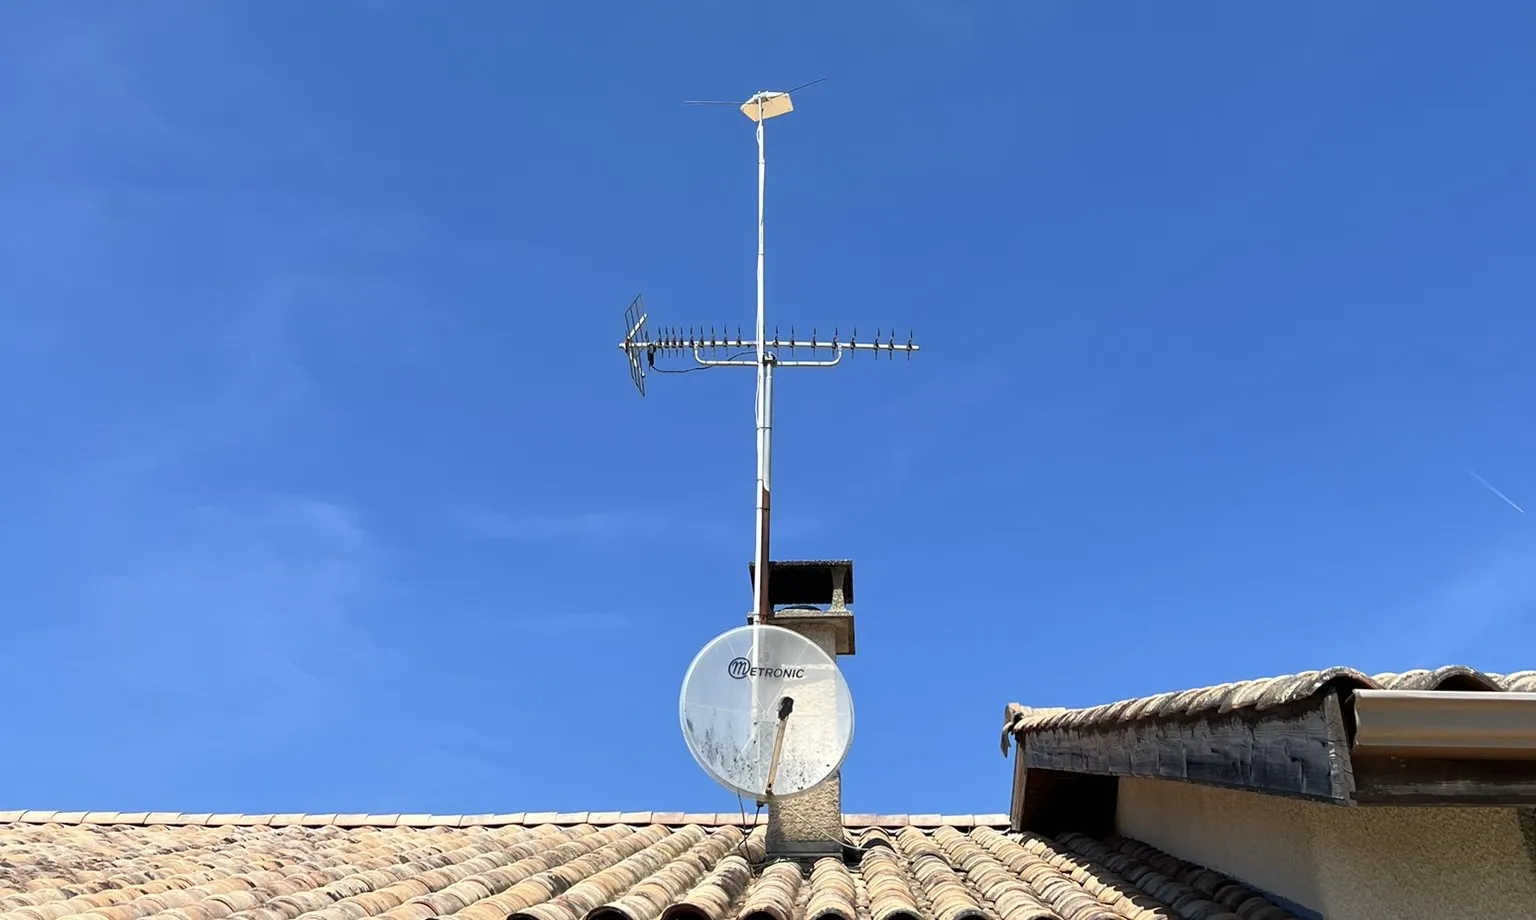
Placement and Orientation
A dipole isn’t omnidirectional, so its orientation matters. NOAA satellites on polar orbits approach either from the north or the south. Orient the antenna towards one direction, if mismatched, you can simply flip the image later.
Here’s the final setup as installed on a south-facing roof:
Note that a dish or Yagi antenna would be entirely different for this project.
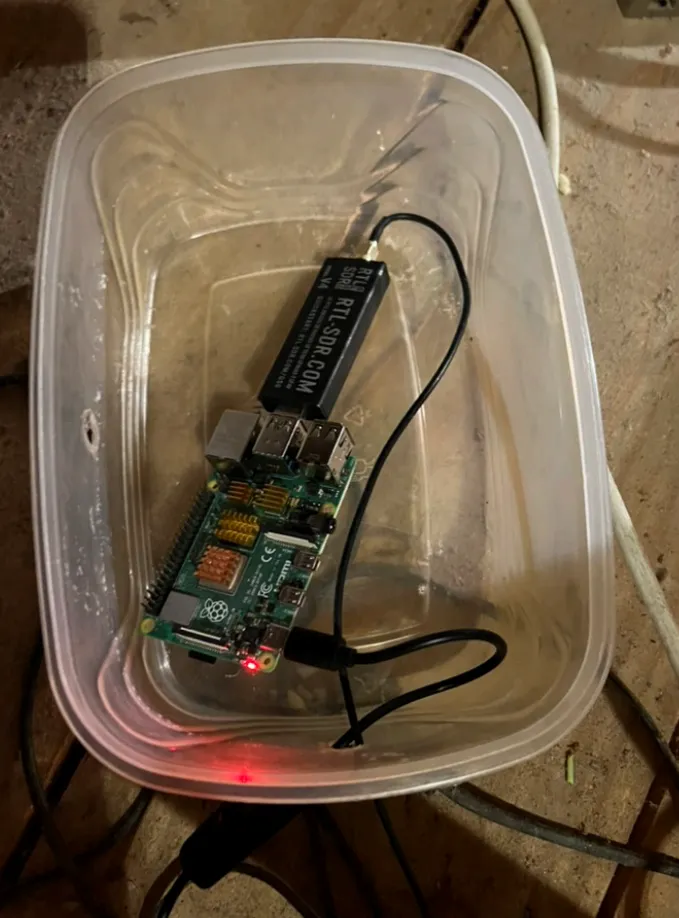
Raspberry Pi
For this project, I use a Raspberry Pi 4 Model B running a 64-bit Raspbian Lite OS, without a graphical interface to minimize interference from the GPU/CPU.
It’s placed in a tupperware in the attic to protect it from dust. The SDR receiver is an RTL-SDR V4 dongle, connected via about 5m of reclaimed TV coaxial cable, though a high-quality cable like RG58 is preferred.
Filter
Although the SDR records the specified frequency, it isn’t perfect, so nearby interfering signals may still be present. Some may consider using an LNA (Low Noise Amplifier) to filter and boost signals in a specific frequency band. For this project, an LNA for 137MHz (like this one) could be used.
It should be placed as close to the antenna as possible.
⚠️ However, in my tests, a filter did not significantly improve performance, so I don’t recommend spending extra on one.
Software
To test your hardware chain, you can first connect your SDR receiver to a computer and use software like SatDump to manually capture a signal.
In theory, if everything works, you could stop there. To take it up a notch, you can automate the process and host a website displaying all captured images 🖼️.
GitHub
For this project, I used this Git repository, which is very helpful.
After cloning the repo on your Raspberry Pi, edit config/settings.yml to update your geographic coordinates and adjust other parameters as needed. For example:
# Coordinates of your installation location.latitude: 37.2387771634851longitude: -115.80047482064876altitude: 1360# Using the more modern noisy-decoding method.noaa_decoder: 'satdump'meteor_decoder: 'satdump'# Crop weak signal periods at the beginning and end of passes.noaa_crop_toptobottom: true# I prefer a natural image without overlays.noaa_map_crosshair_enable: false...
noaa_map_grid_degrees: 0.0...
noaa_map_country_border_enable: false...
noaa_map_state_border_enable: false
Then run the installation script ./install_and_upgrade.sh (it will take a while) to set up a website displaying scheduled passes, auto-started recordings, and a "Capture" page with all images.
Remote Access
After installation, an nginx web server is set up on your Raspberry Pi, accessible via localhost on the local network.
If you have a custom domain and wish to access your site from anywhere, link it to your router’s public IP. GitHub tools let you generate easy HTTPS certificates for added security. See this guide for details.
Prediction
A daily cronjob runs at midnight to fetch the latest TLE data (Two-Line Elements) for the satellites. These data mathematically represent orbital parameters used to predict when a satellite will pass overhead.
This updated database is then used by the predict tool, which, given your geographic coordinates from settings.yml, provides a time window when a satellite will pass, including its maximum elevation.
For example, running:
shows that the next pass is between 19:02 and 19:17, with maximum elevation at 19:09 and around 64°.
Signal Processing
But what do we actually record, images? Not quite. The SDR captures an audio file!
The main command looks like:
./satdump live noaa_apt --source$receiver--samplerate$samplerate$ppm_correction--frequency"${NOAA_FREQUENCY}e6"--sdrpp_noise_reduction$gain_option$GAIN$crop_topbottom--start_timestamp$PASS_START--save_wav$finish_processing--timeout$CAPTURE_TIME
This command records and processes the audio signal into an image. More details on the arguments can be found here and here.
Image Retrieval
Once the processing is complete, SatDump applies image processing as specified in settings.yml to generate various outputs (colored images, thermal images, etc.). These are then available on the “captures” page of your website.
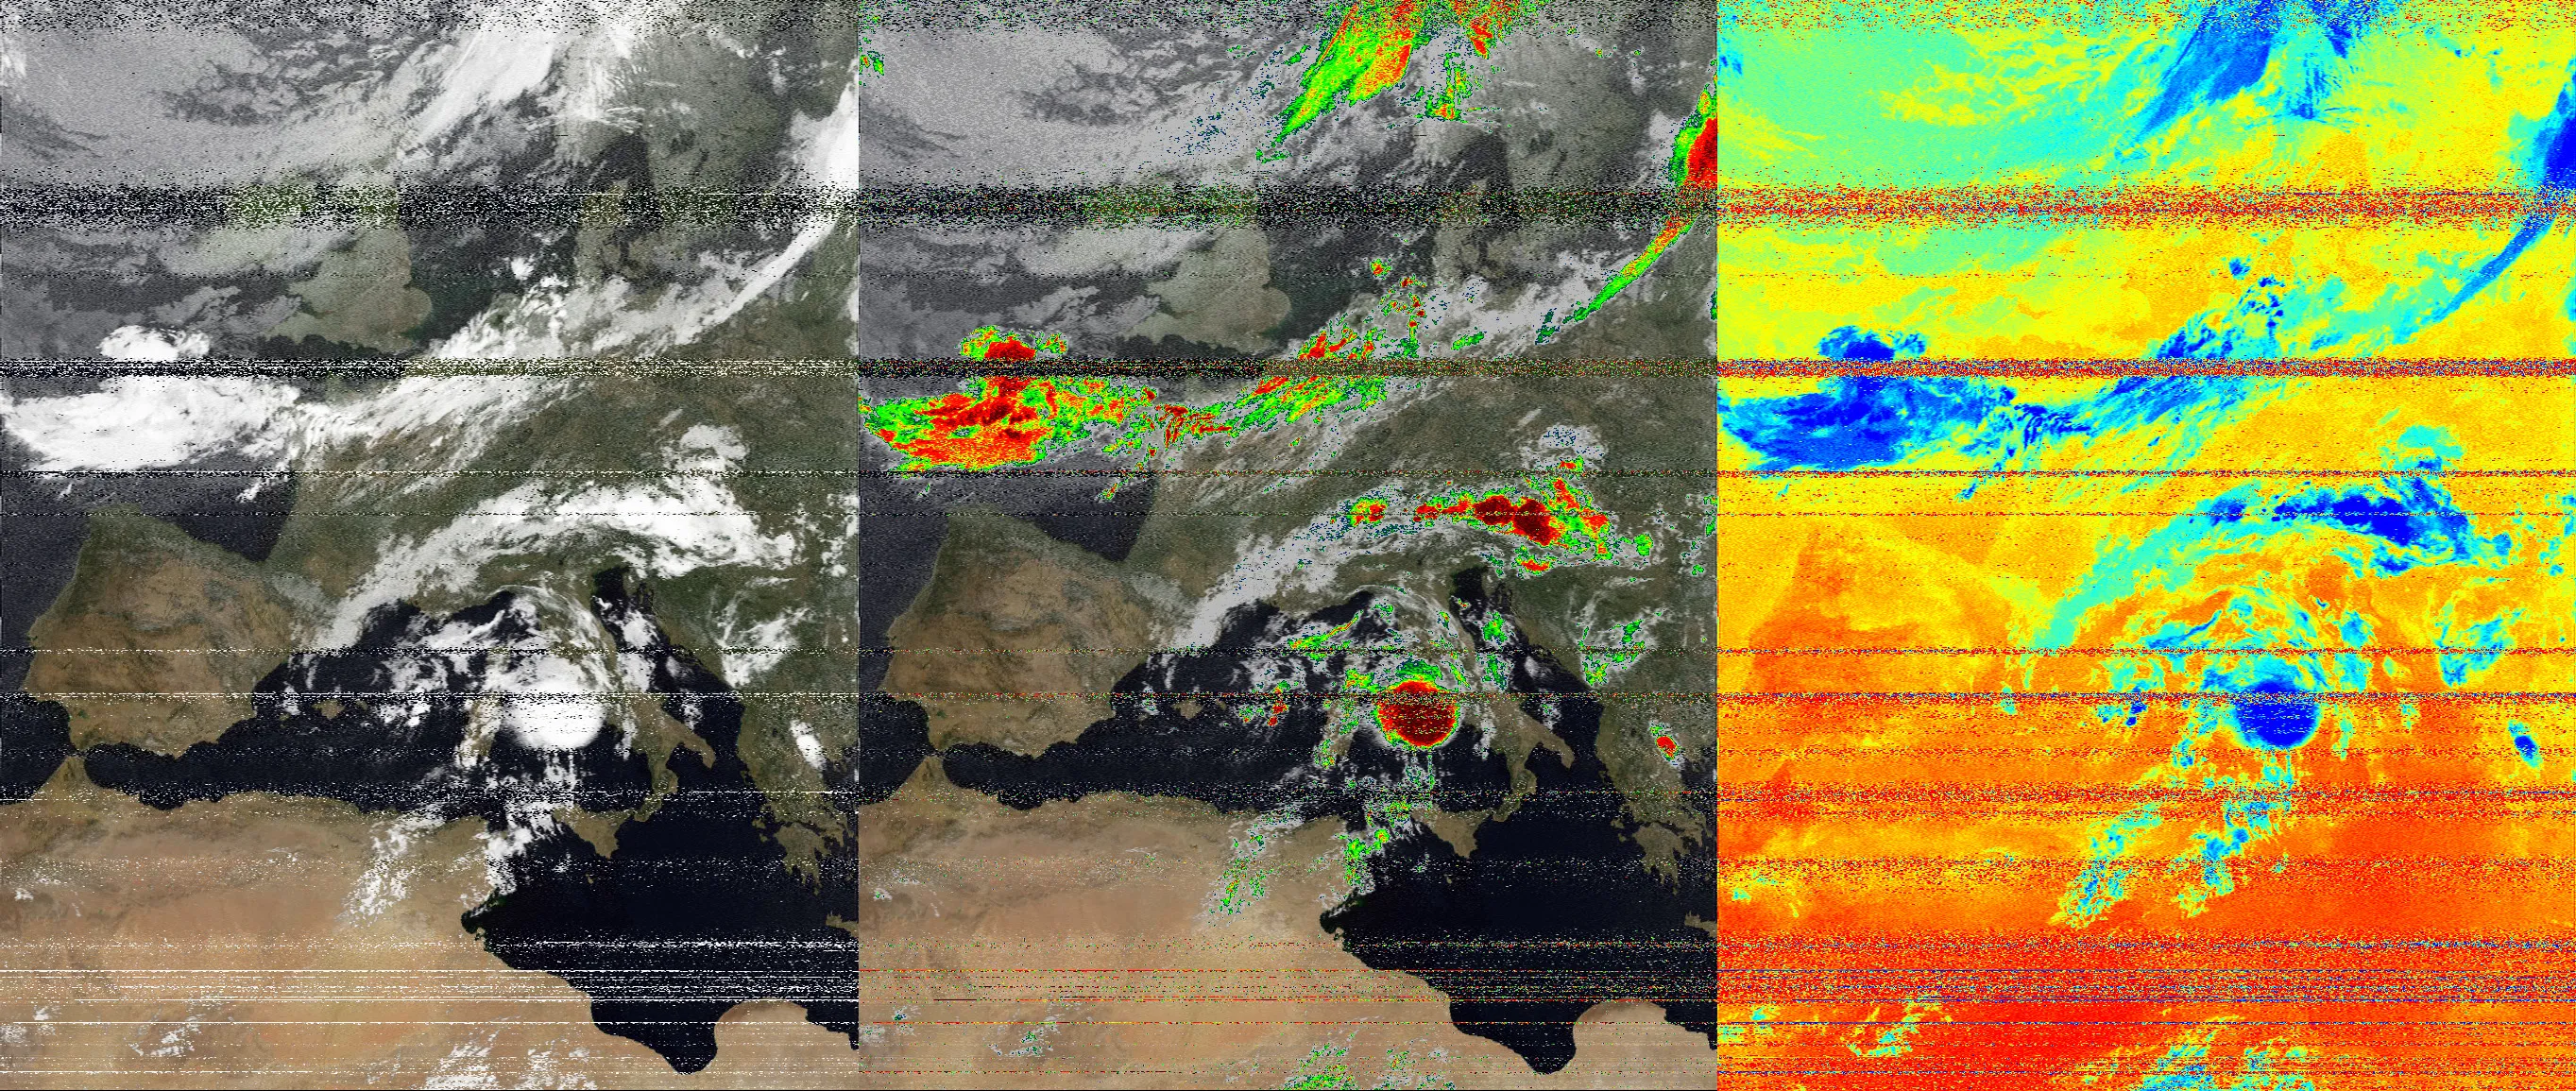
For instance, here’s a processed image from NOAA 19:
You’ll notice some bands in the middle due to interference from my imperfect antenna, I’m working on that.
What's Next & Improvements
METEOR
If you’ve set everything up right, you should also see two other satellites labeled METEOR, which are also weather satellites transmitting on 137MHz. With the same equipment as for NOAA, you can receive these too. More details on these Russian satellites can be found here.
HRPT
In fact, these satellites can send even better images. As mentioned, APT dates back to 1960, even though these satellites were launched in the 2000s, this is for backward compatibility with old receivers. In practice, meteorologists use a more modern protocol: HRPT (High-Resolution Picture Transmission). NOAA uses HRPT on higher frequencies (around 1700MHz). Receiving HRPT requires advanced techniques and a different antenna. It’s the logical next step to get sharper images, while APT offers roughly 4km/pixel, HRPT can deliver 1km/pixel, like upgrading from FULL HD to 4K :)